Groenezoom 2 2811VH Reeuwijk
Description
Located in Reeuwijk, this beautiful and spacious Between or semi-detached house is located on Groenezoom. The Between or semi-detached house has a living area of 122 m2 and is located on a spacious plot with an area of 168 m2. The Between or semi-detached house was built in 1968.
This text is auto-created based on public characteristics of Groenezoom 2 in Reeuwijk.
Characteristics
Construction
Division
Location
Address
WOZ-value
The total value development of Groenezoom 2 is 148.9%.
| Identification: 190100021156 | |||
| Year | Value reference date | Value | Value development |
| 2024 | 01-01-2024 | € 453.000 | +9.42% |
| 2023 | 01-01-2023 | € 414.000 | +6.43% |
| 2022 | 01-01-2022 | € 389.000 | +18.6% |
| 2021 | 01-01-2021 | € 328.000 | +20.15% |
| 2020 | 01-01-2020 | € 273.000 | +13.28% |
| 2019 | 01-01-2019 | € 241.000 | +9.55% |
| 2018 | 01-01-2018 | € 220.000 | +10% |
| 2017 | 01-01-2017 | € 200.000 | +4.17% |
| 2016 | 01-01-2016 | € 192.000 | +4.35% |
| 2015 | 01-01-2015 | € 184.000 | +1.1% |
| 2014 | 01-01-2014 | € 182.000 | n/a |
Province price index
Noise pollution

To whisper
Softly playing radio
Loud playing radio
Horn
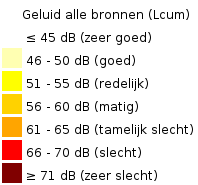
At dB(A), the addition (A) means that the sound intensity has been made perceptible to the human ear by means of filtering. The corresponding legend indicates the possible indications of the loudness levels.
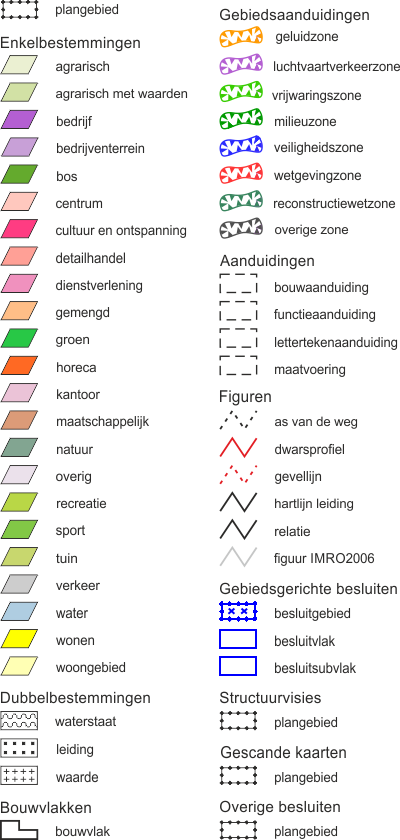
Destination of Groenezoom 2
Click on the icon on the right top corner on the map to see the legend of the destination map
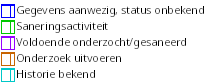
Soil investigation Groenezoom 2
Click on the icon on the right top corner on the map to see the filters and the legend of the soil investigation map
This map gives you insight into the data known to the government regarding the soil quality of Groenezoom 2 and the surrounding area. You can also see where (business) activities have taken place in the past that deserve extra attention because they could have influenced the soil quality.